When doing any research project, it is important to know which tools are available for you to use to make the most of your data. This becomes even more important when collaborating in a research team since everyone has to be on the same page at any given moment.
As you read this article, keep in mind which features you need for your research in order to help you determine which software(s) may be best suited to your needs. It can be helpful to discuss these different options with your advisor and with peers in order to get an idea of which tools and workflows others are utilizing when engaging in similar work.
This article presents different resources available to you for each step of the research process, linking to external articles that present more information about each resource. Some of the software discussed in this article can be found on UIT’s Essential Software page or the Software at Stanford page.
Topics covered in this article include:
- Organizing sources
- Managing ideas and actions
- Procuring data analysis software
- Analyzing qualitative data
- Analyzing quantitative data
- Presenting research
- Next Steps
Organizing sources
When gathering sources, consider how to document your process effectively and efficiently for sharing across teams as well as for later reference when distilling information. Here are some tools:
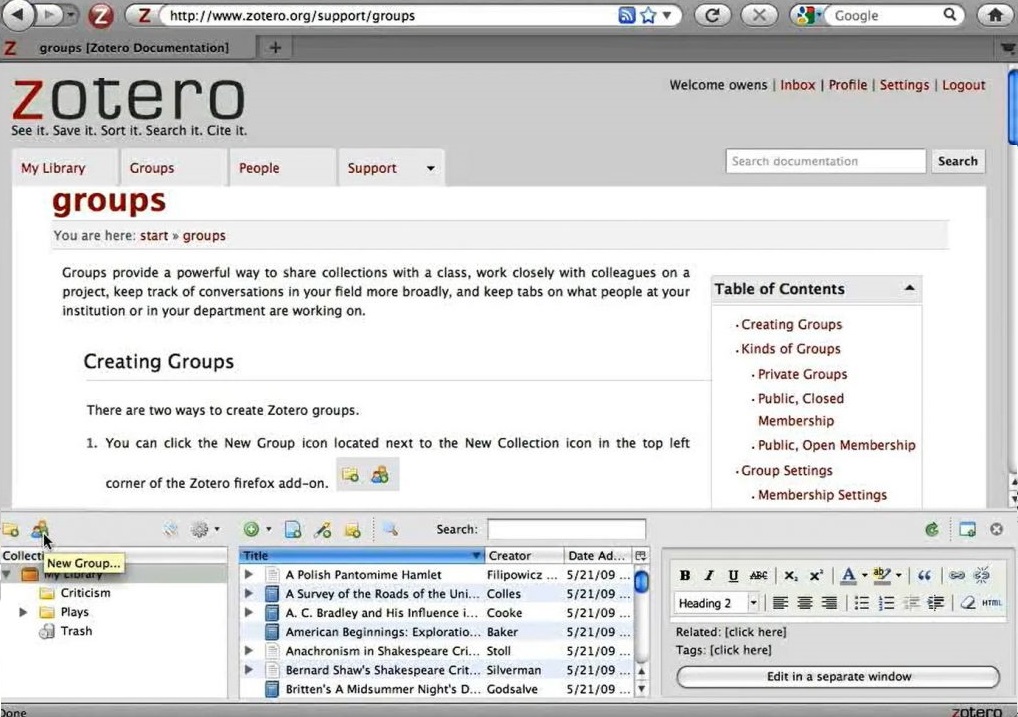
- Zotero Groups: sharing collections and working closely with colleagues on projects
- Hypothesis: annotating as a team over digital media (websites, PDFs, etc.)
- PowerNotes: digital annotation and organizing online content into topics and research questions
Managing ideas and actions
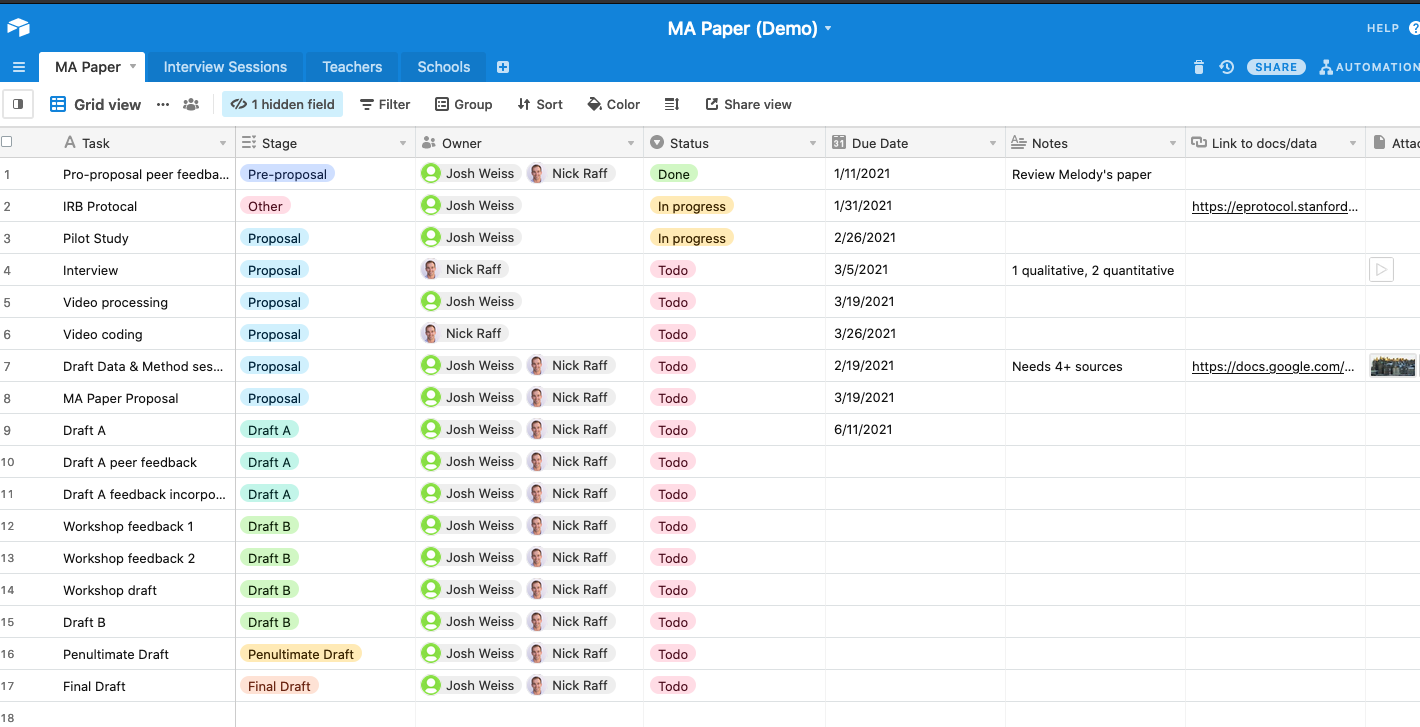
For managing and organizing research ideas and projects, Airtable, an online spreadsheet-database collaboration service, can provide a centralized view of all data, tasks, timelines, etc. To get started, Airtable offers templates and open-sourced projects, which users can adopt and modify for their own projects. For more information on Airtable workflows, check out the GSE IT Airtable Workshop and review the presentation on using Airtable for Research and Project Management.
Beyond Airtable, Google Docs has broad adoption and is consistently updating features for task-handling and version control. As an alternative, Etherpad and Quip facilitate drafting and project workflows for remote teams that cannot access the Google Suite.
Procuring data analysis software
The Social Science Data and Software (SSDS) group Getting Started Guides and Documents page contains links to support documents for some of the most popular quantitative, qualitative, and data conversion software at Stanford as well as a list of other software and resources. However, before buying any software, be sure to first check out the software to which Stanford already provides licenses.
Analyzing qualitative data
To compare qualitative data analysis software (QDAS), consider the use case and compare features accordingly. Green Library offers guides and expert consulting to assist with QDAS selection and use. Below you will find key links and optimal cases for the most common QDAS:
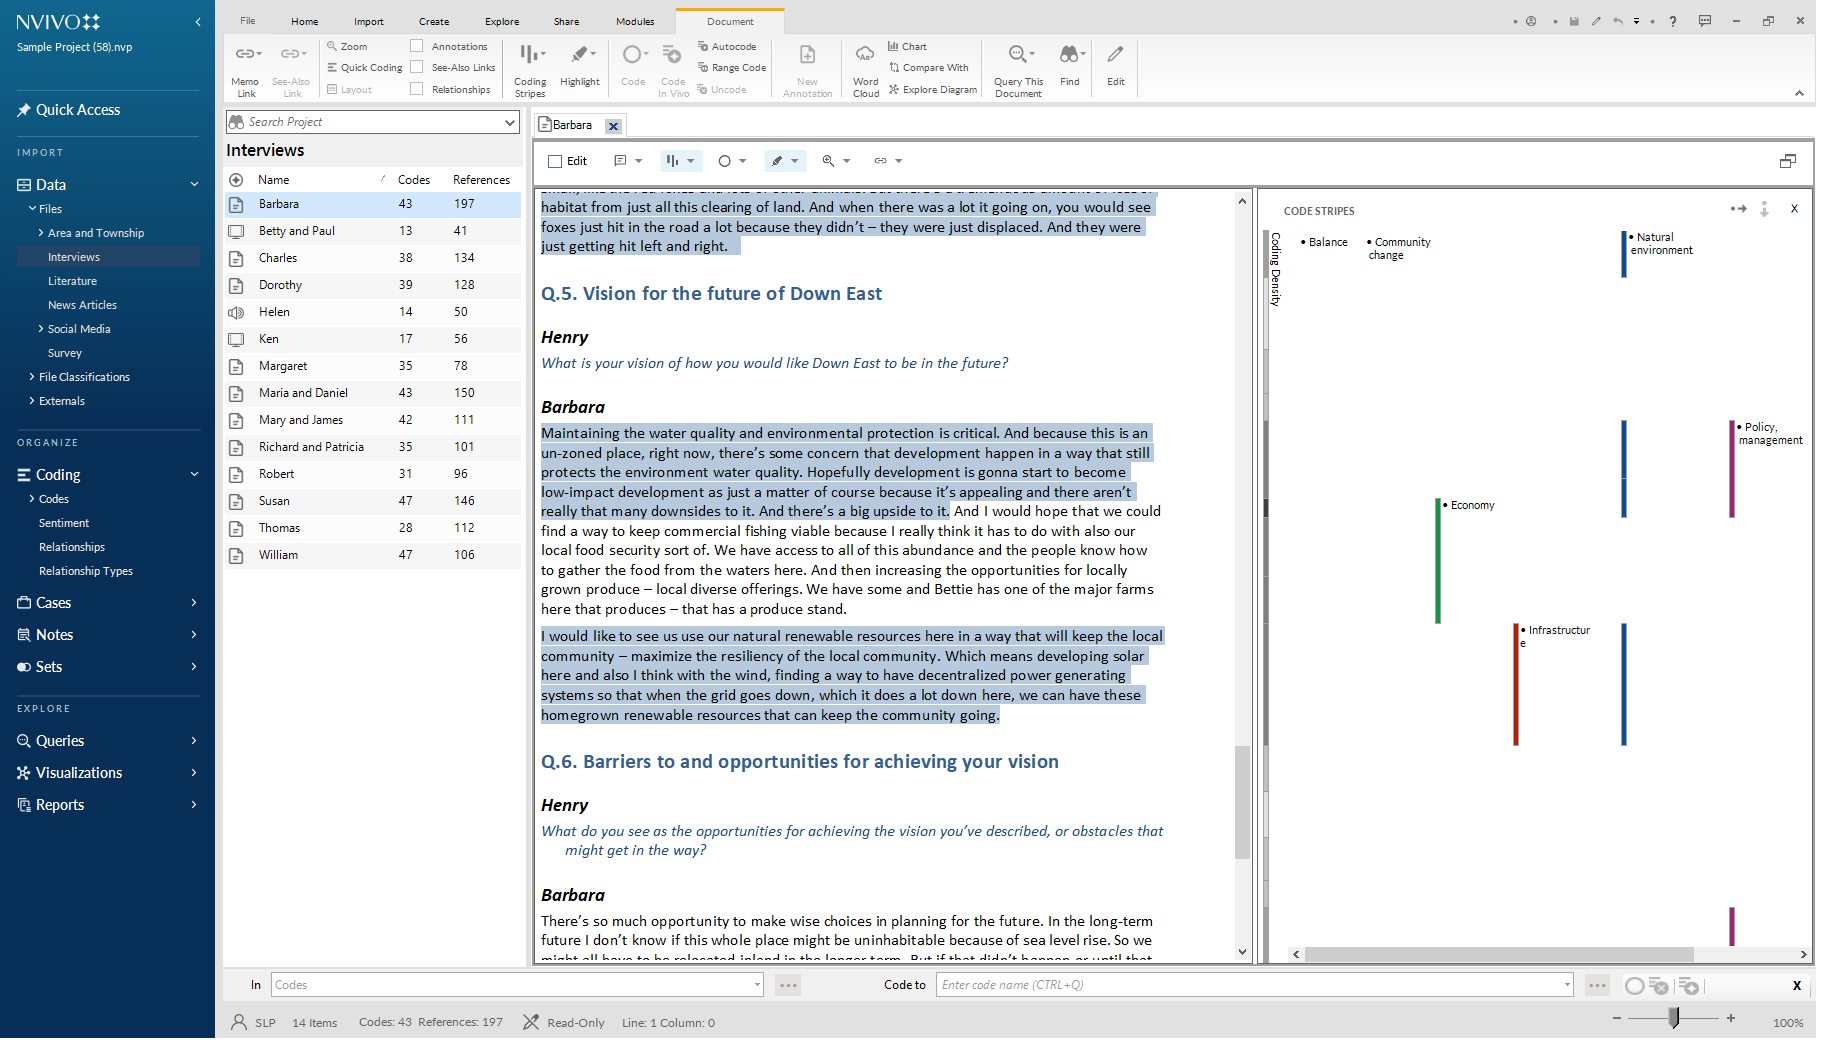
- NVivo Teams: desktop-based projects that require advanced tools like autocoding
- Dedoose: an inexpensive web-based platform that enables team members to see each other’s work in real-time
- Quirkos: simpler datasets for entirely qualitative analysis when NVivo isn’t an option. Quirkos vs. NVivo comparison here
Analyzing quantitative data
Green Library offers workshops and consulting via the SSDS and CIDR groups. When selecting quantitative data analysis software, compare features according to the needs of your project, as with this summary or the table below:
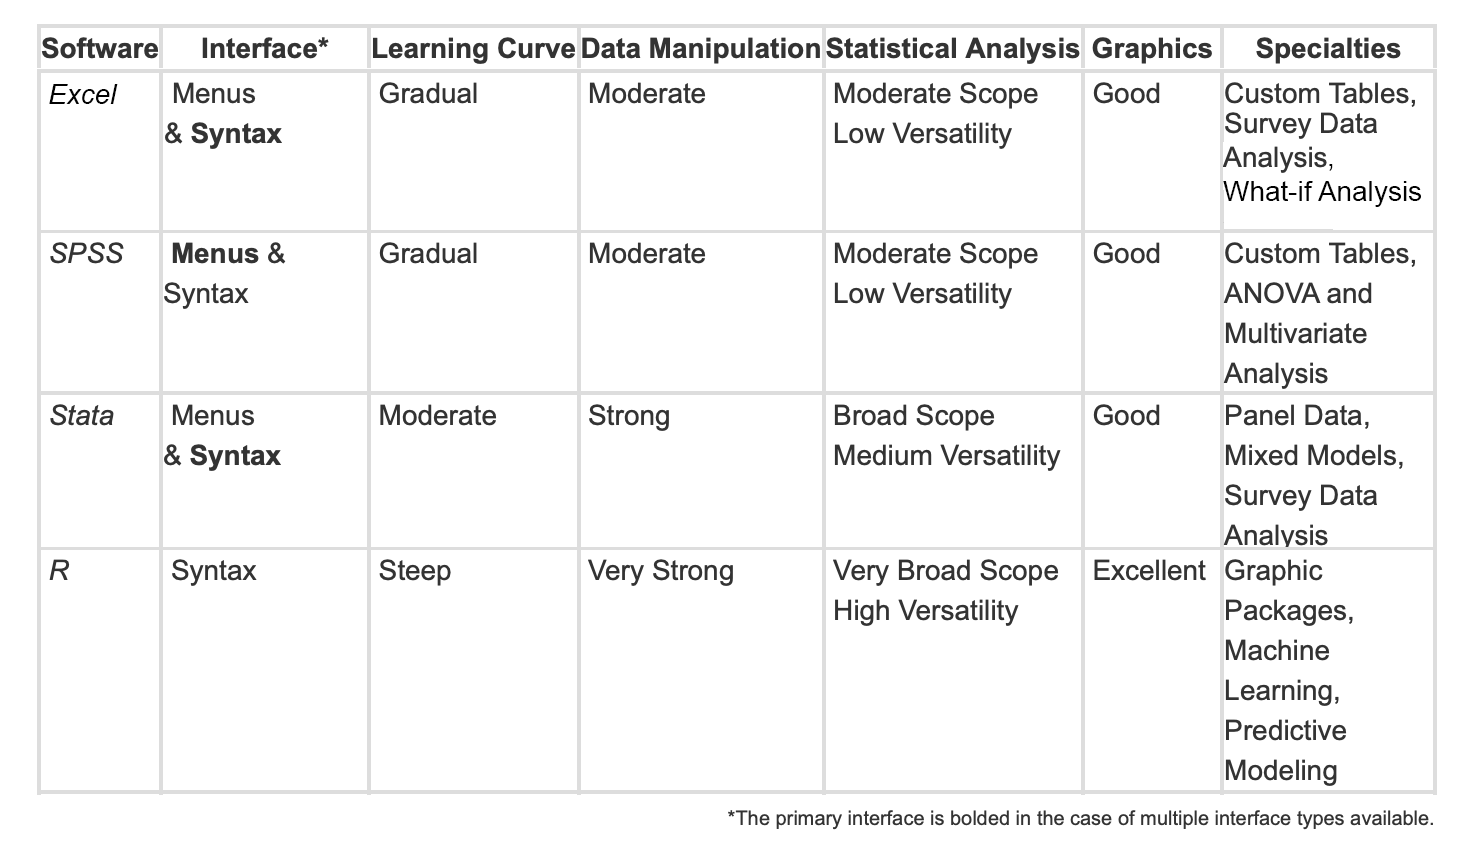
- Excel: one-time analyses of small data sets and for data visualization. Free license with a SUNet here.
- SPSS: fast and easy multivariate statistical analyses for large datasets and production-ready analyses
- Stata: intuitive multivariate and mixed model data analysis and visualization (for smaller datasets than SPSS)
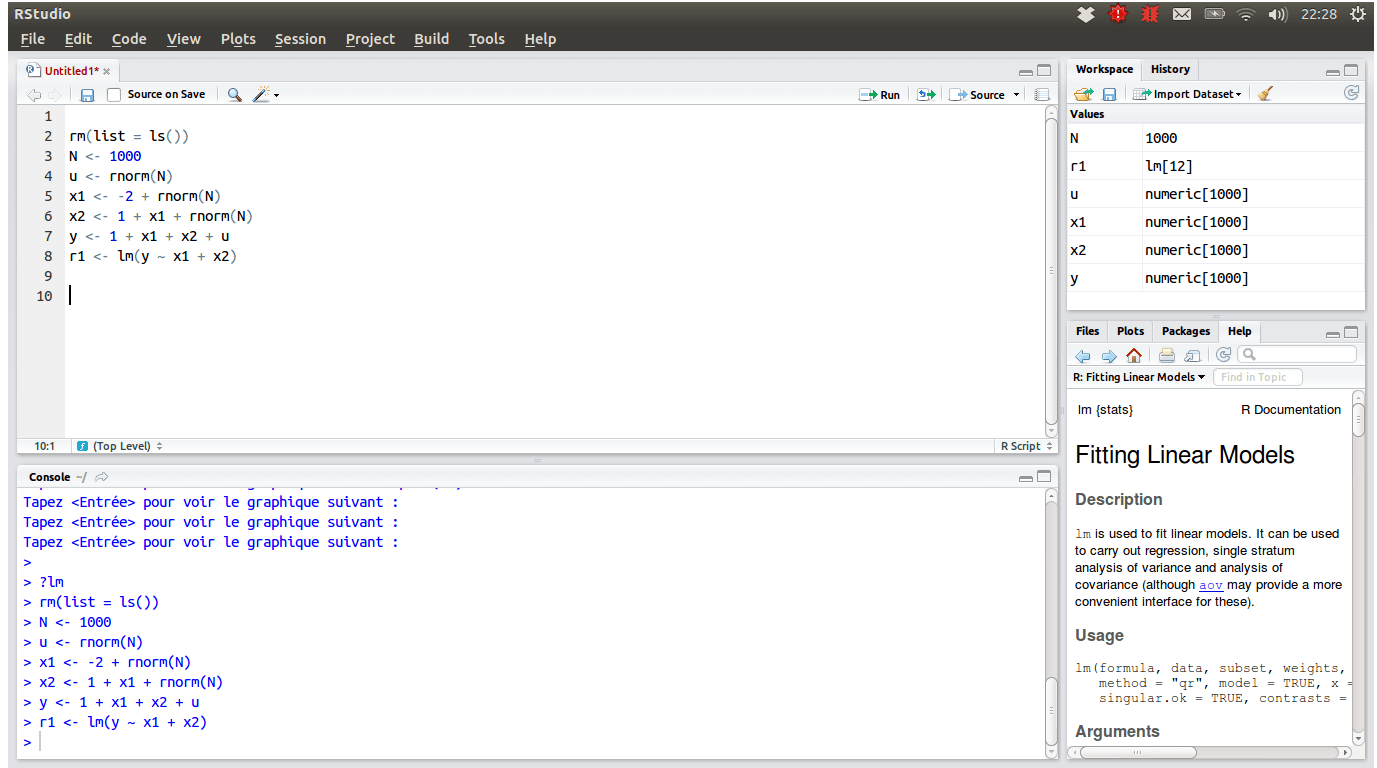
- RStudio: researchers who use a variety of models. Produces visually appealing graphs and charts with packages and RStudio Cloud that can support team dynamics. Steep learning curve but open-sourced with large communities of online support. See past GSE workshops on Up and Running with R and Workflows with R Studio.
If you would like to learn more about advanced quantitative analysis or are trying to choose between tools, feel free to check out this Comparison Table that illustrates the differences with using R, Stata, or Python for data science.
Presenting research
When reporting out findings, determining the right narrative, visualization and delivery method is crucial. Some common tools used by GSE community members include:
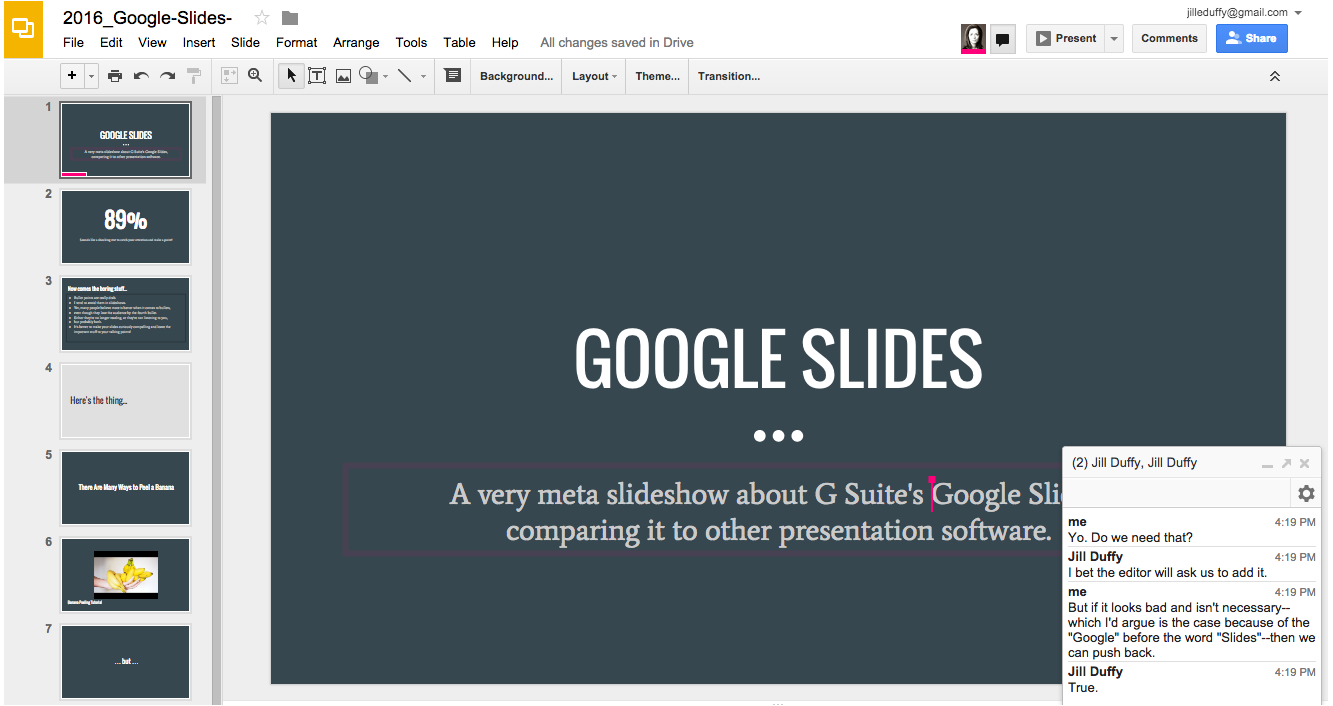
- Google Slides: similar format to Microsoft PowerPoint, with additional accessibility (e.g., real-time AI transcription) and collaboration features
- Tableau: interactive presentation of data, i.e., click and drag around data to explore and discover
- Glogster: interactive posters with rich media integration
Next Steps
If this is your first time thinking about which software or programs to use during your graduate school experience, it can be extremely helpful to talk with your advisor and your peers about which tools they use, how they use them, what they like about them, etc. If you find that you want more support regarding using some of these different programs or software, there are a number of student groups on campus and external resources that you can consult:
On Campus
- SRCC provides support and consultation on your specific computing needs and problems
- ATSL, part of the Center for Teaching and Learning, offers resources and training
- CTASS, an interdisciplinary student group with representatives from Education, Political Science, Psychology, and Sociology, holds bi-weekly workshops and collects resources
- CESTA, a digital humanities center, offers resources for learning about new tools as well as funding opportunities
Workshop Recordings
- Up and Running with R on 01/31/2020
- Facilitators: Ben Stenhaug, Klint Kanopka, and Lief Esbenshade (PhD candidates, GSE)
- Content: Introduction to R, including simple data import, data cleaning, data visualization
- Target audience: beginners with a general interest in R/RStudio/RStudio Cloud; intermediates who want exposure to best practices in analyzing data with R
- Humane Workflows in RStudio on 10/17/2019
- Facilitator: Joseph T. Powers
- Content: Best practices in RStudio workflow and use of Github for research work
- Target audience: intermediates with some past experience in using R or other similar programming languages who seek to adopt best practices.
Online courses
- Udemy provides online video courses on topics such as Python, Excel, JavaScript, and Data Science
- Coursera offers courses, specializations, and degrees around topics like R, Excel, MATLAB, and statistics
- Datacamp provides free interactive introductory courses to topics such as R, Python, Data Science, etc., with additional courses on ‘career’ and ‘skills’ tracks.